
Mastering Chart Patterns: Ultimate Guide to Spotting Trend Reversals
One of the key skills every successful trader needs is the ability to read chart patterns. These patterns can give you early warnings of trend shifts, helping you make more informed decisions. Let's break down some of the most important reversal patterns you'll want to keep an eye on.
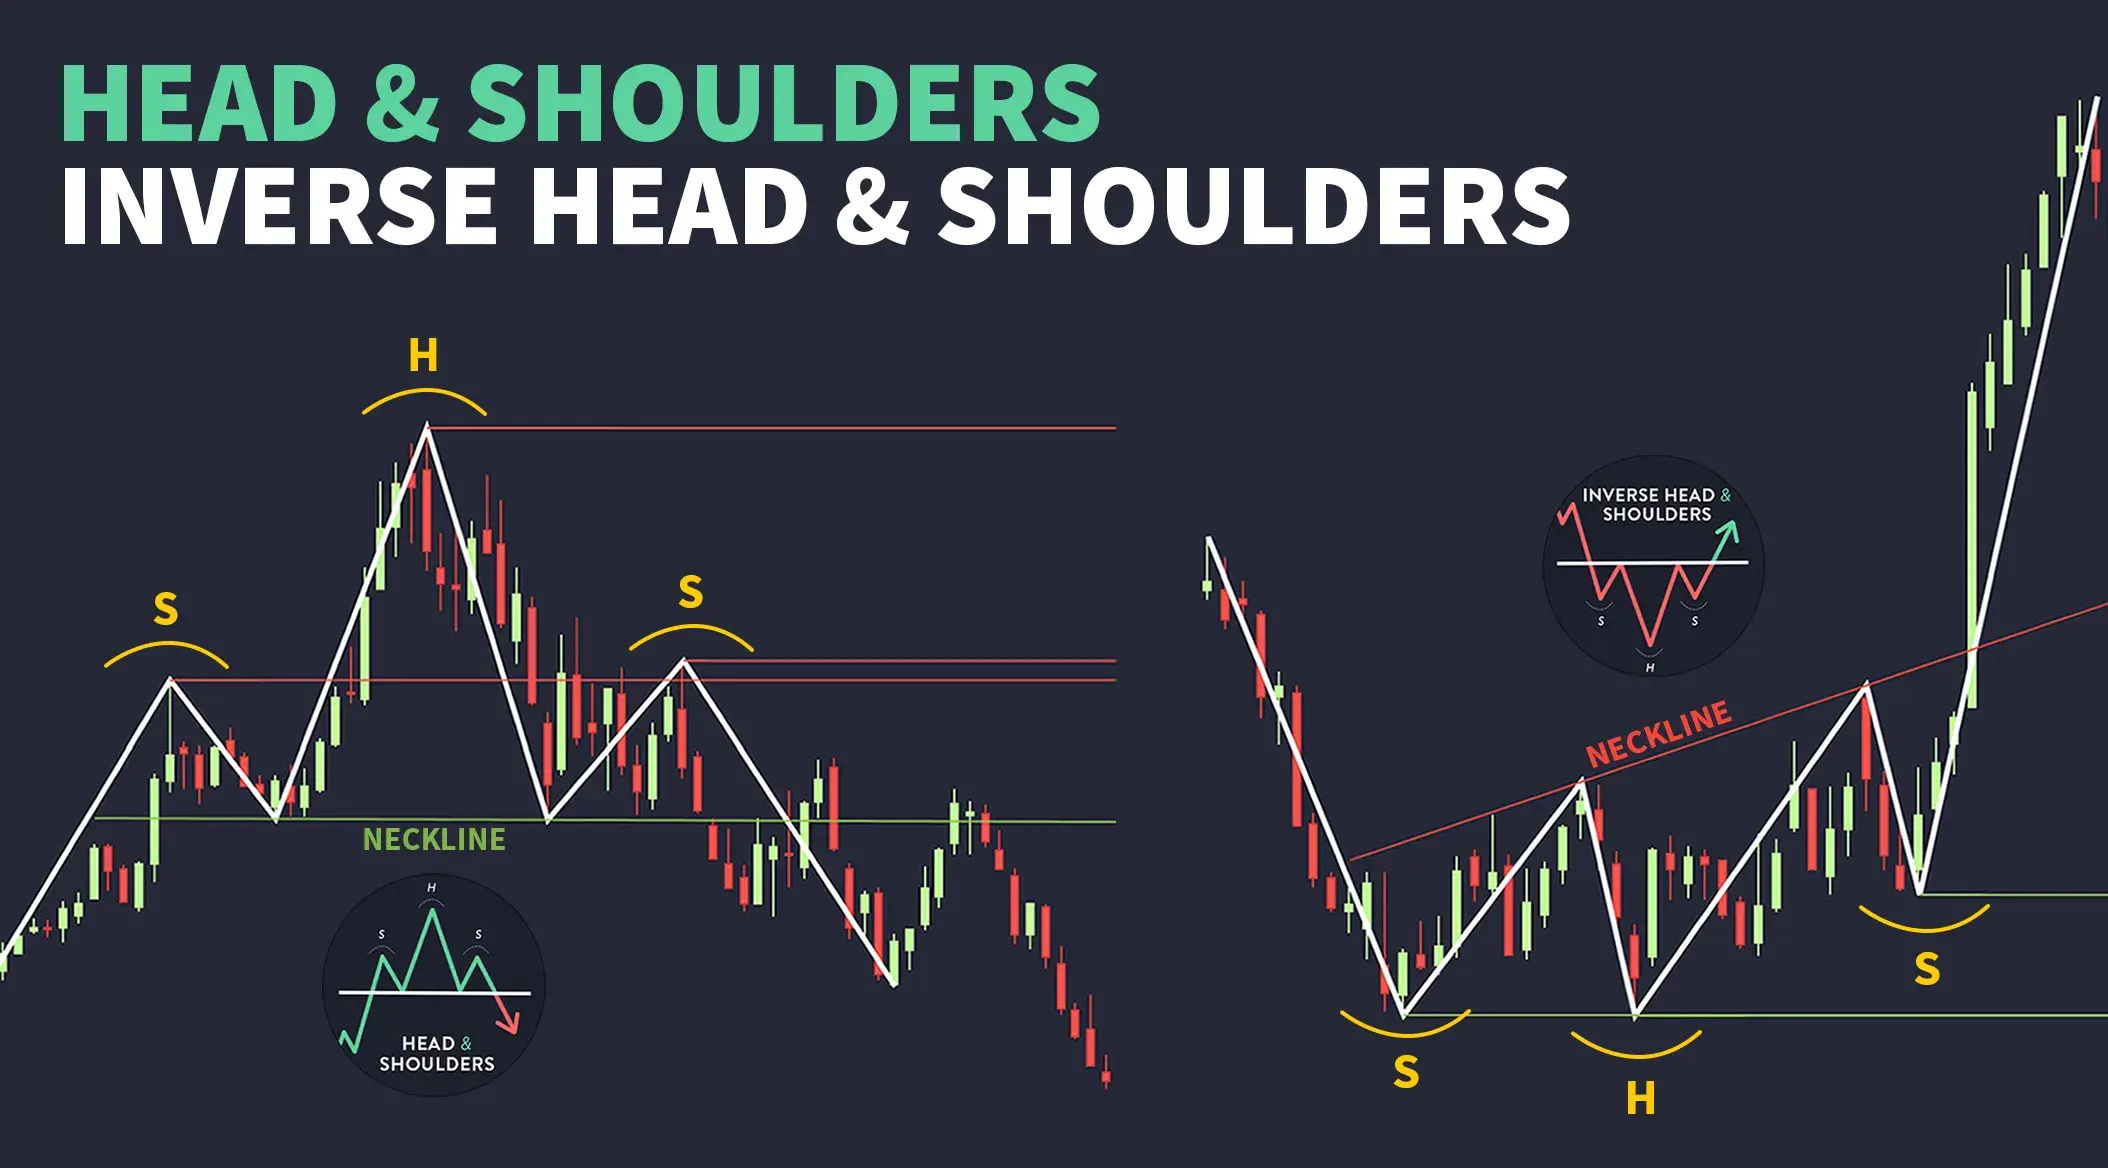
1. Head and Shoulders & Inverse Head and Shoulders: The Peak and Trough Indicators
Trend reversal patterns are signals that the current market movement could be about to shift direction. The Head and Shoulders pattern forms when a peak (the head) appears between two smaller peaks (the shoulders). If you spot this, it often indicates a potential downturn.
On the flip side, the inverse of this pattern – with a trough (the head) between two higher troughs (the shoulders) – suggests an uptrend may be on the horizon.
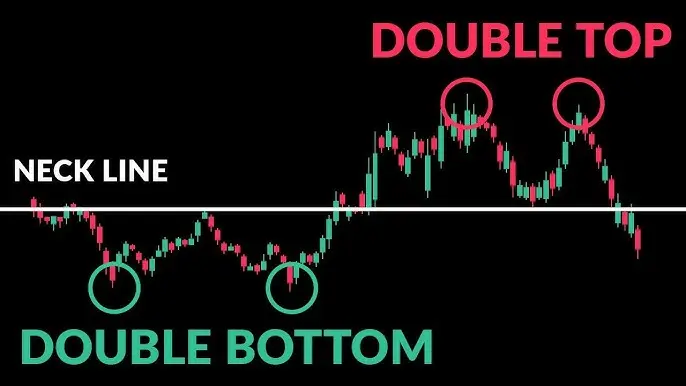
2. Double Top and Double Bottom: Identifying "M" and "W" Shaped Patterns for Trend Changes
- Double Top – Shaped like the letter "M," this pattern emerges at the peak of an uptrend and often signals a reversal toward a downtrend.
- Double Bottom – Resembling a "W," this pattern appears after a downtrend and can indicate the market is about to shift direction and move upwards.
By understanding and recognizing the Head and Shoulders, Double Top, and Double Bottom patterns, you can significantly improve your trading strategy. These patterns offer valuable insights into when a market reversal might be coming, giving you an edge over other traders.