
RSI: Simple Buy & Sell Signals
📊 Want to know when to buy and sell with confidence? The RSI (Relative Strength Index) helps you spot overbought and oversold conditions—so you can make smarter trading decisions!
🔹 What You'll Learn:
✅ Buy Signal – When to enter a trade.
✅ Sell Signal – When to exit and take profit.
✅ What is RSI? – A quick overview of this powerful indicator.
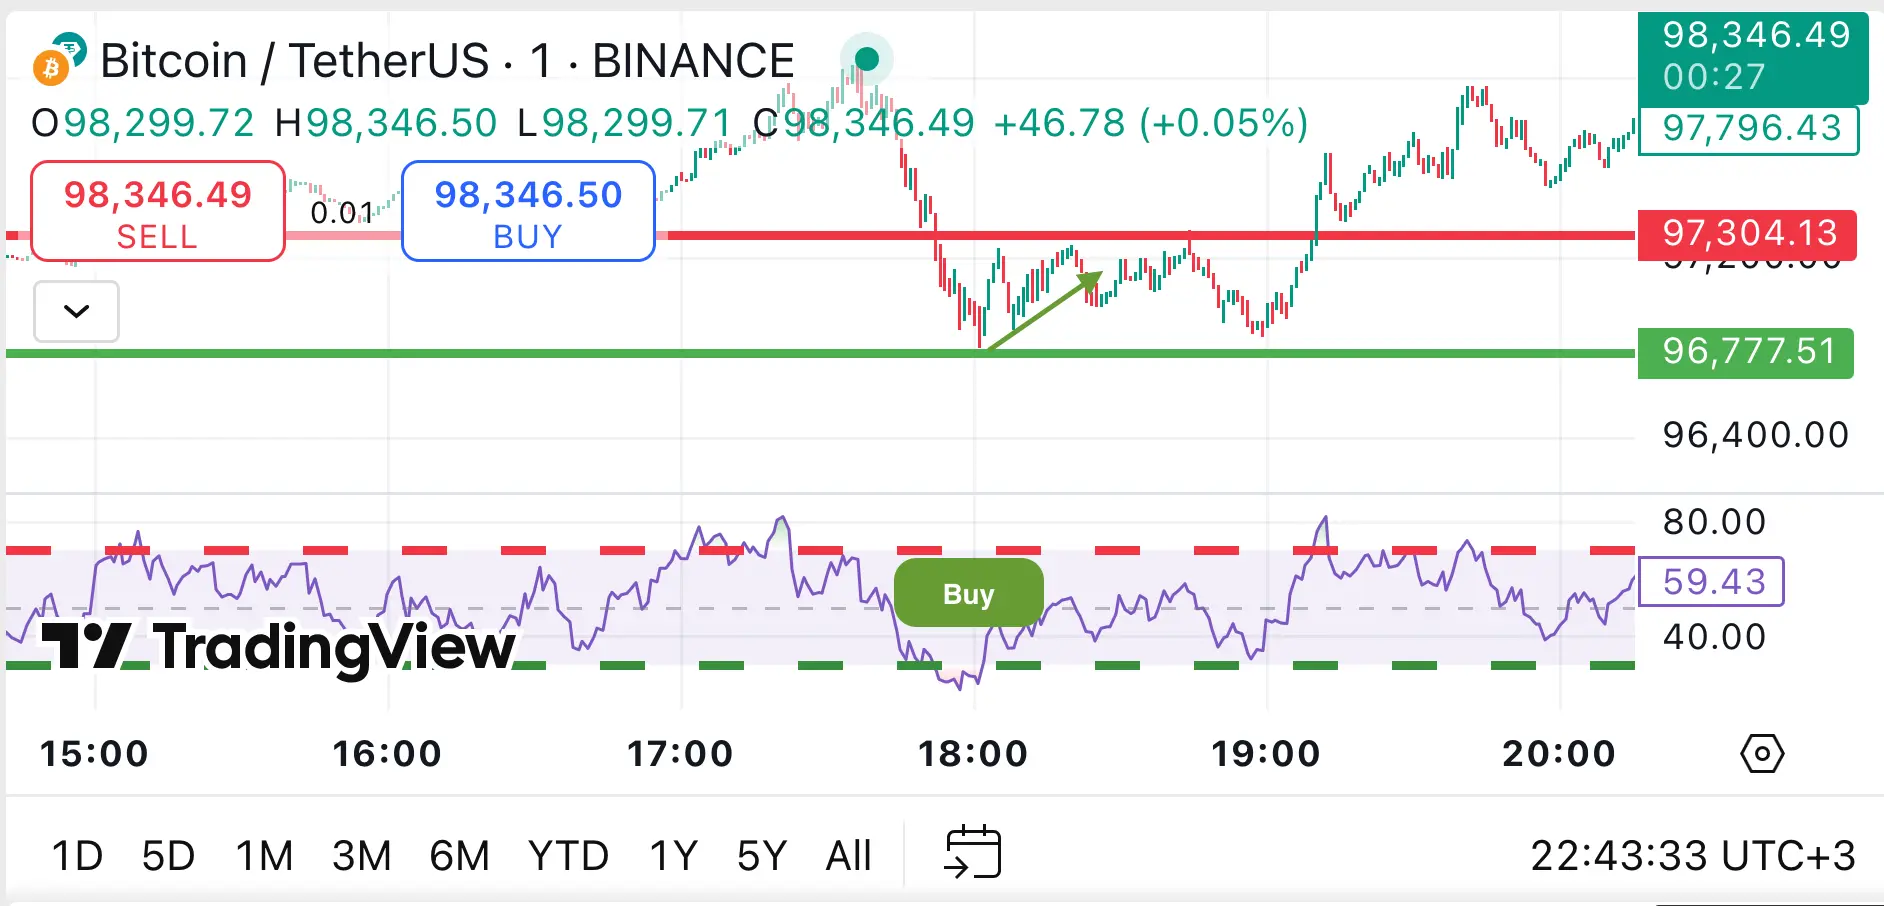
1️⃣ Buy Signal: When to Enter a Trade
📉 RSI Below 30 = Buying Opportunity
✔️ When RSI drops below 30, it means the asset is oversold (heavily sold by traders).
✔️ This suggests that a price rebound may be near, creating a potential buy opportunity.
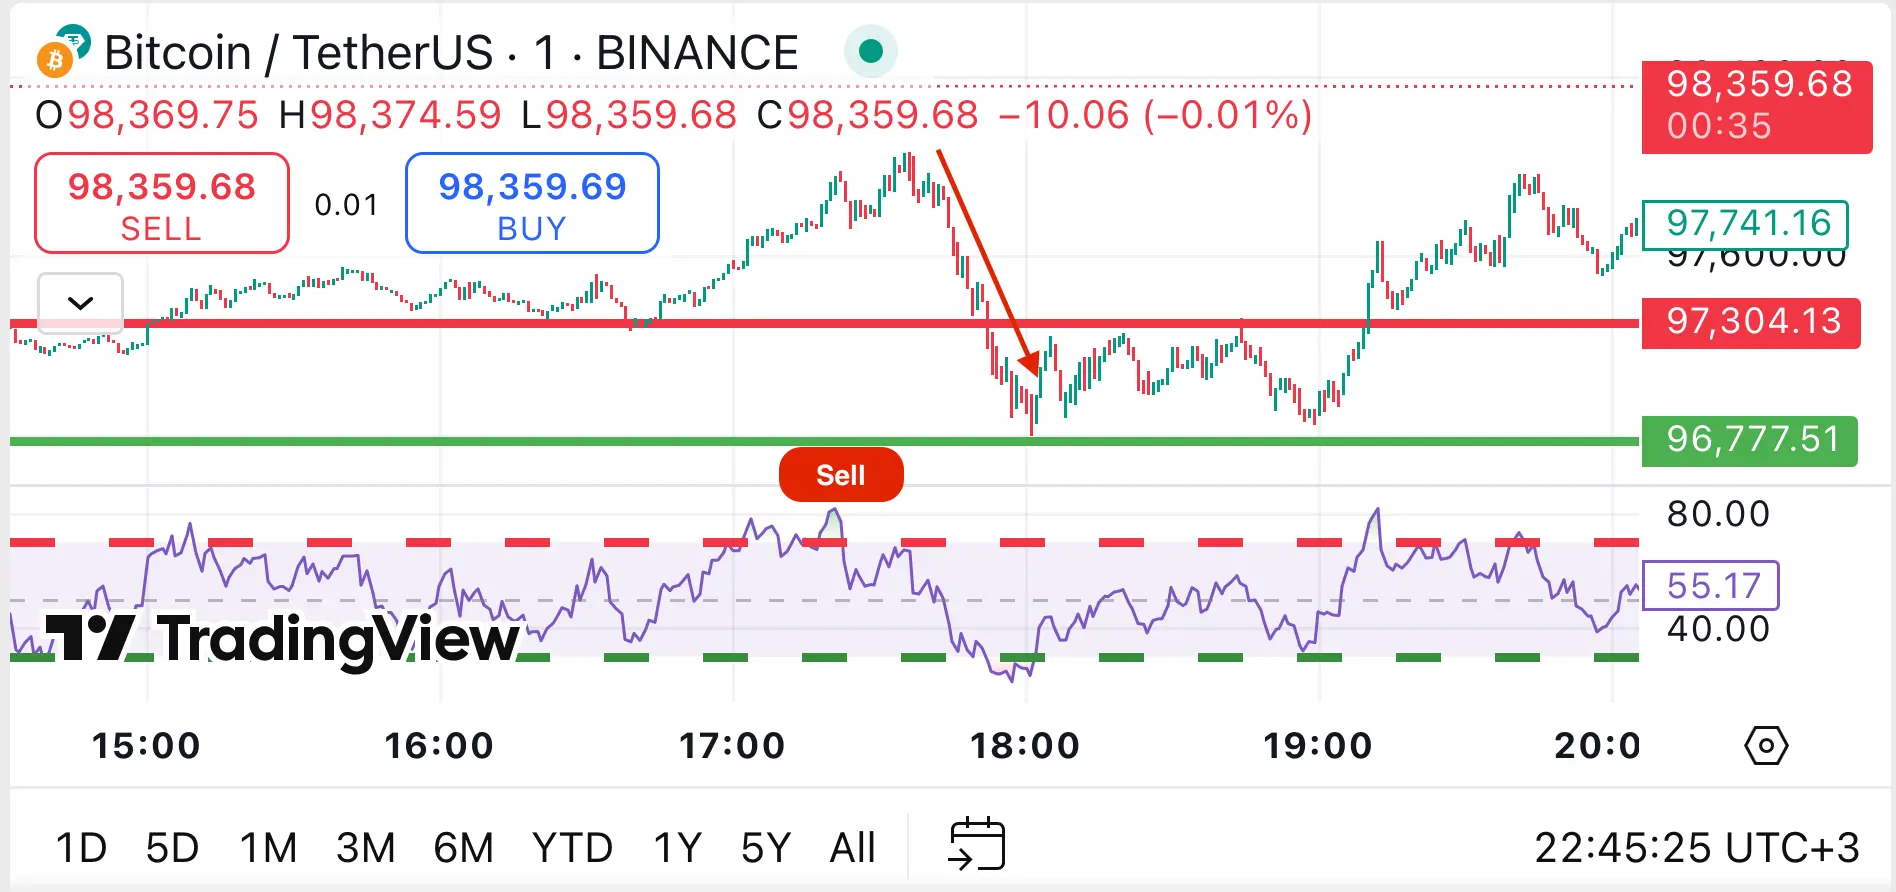
2️⃣ Sell Signal: When to Exit a Trade
📈 RSI Above 70 = Selling Opportunity
❌ When RSI rises above 70, it means the asset is overbought (heavily bought by traders).
❌ This suggests that a price drop may be coming, making it a good time to sell high.
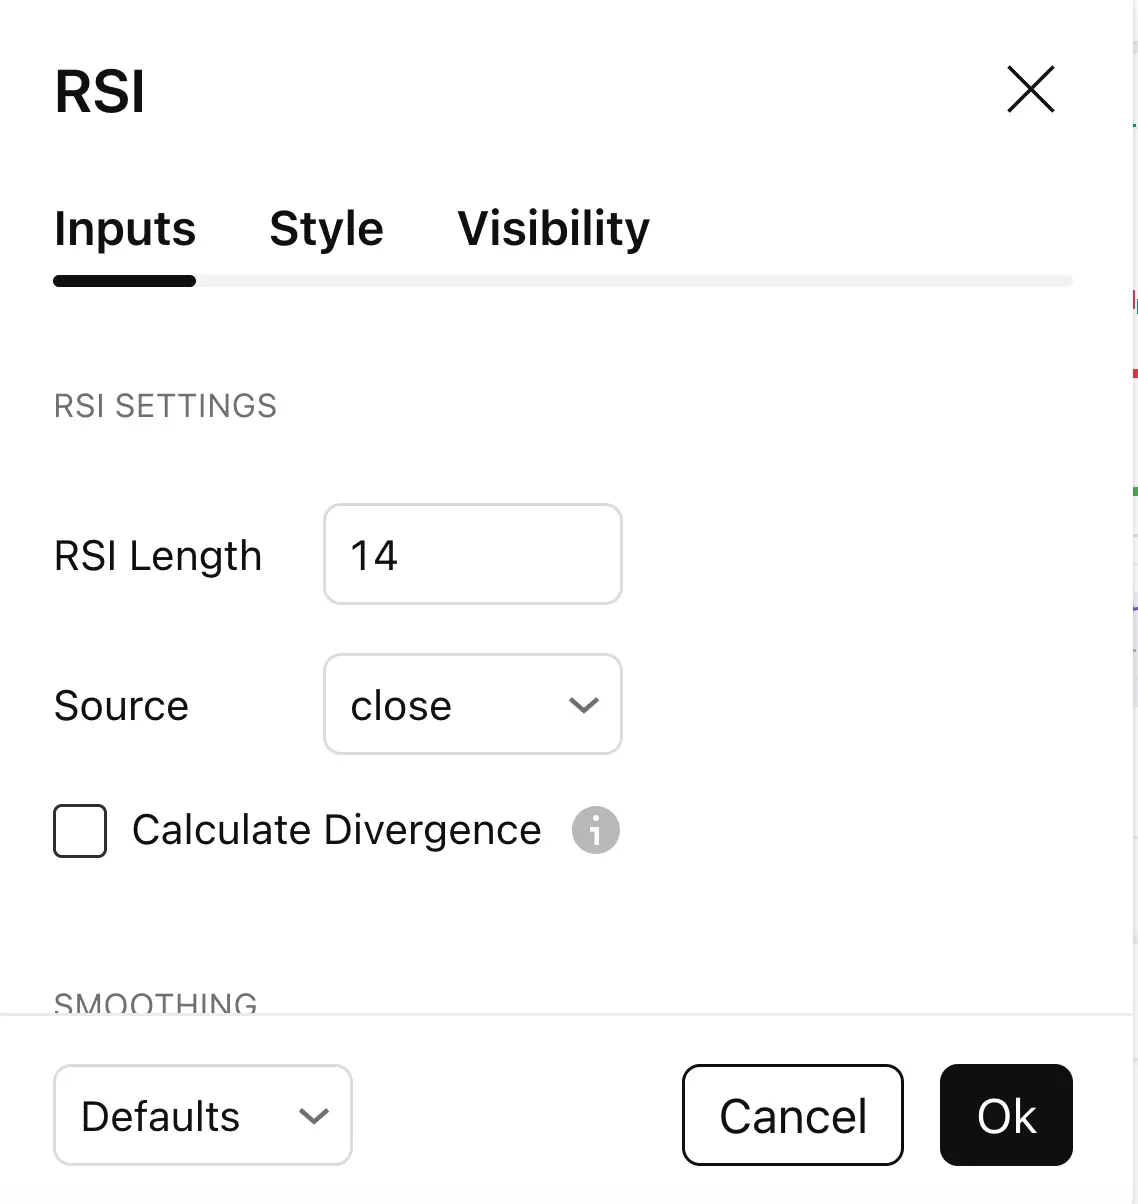
3️⃣ What is RSI?
RSI (Relative Strength Index) is a momentum indicator that measures the strength and speed of price changes.
📊 RSI values range from 0 to 100:
✔️ Below 30 = Oversold (Possible price increase)
❌ Above 70 = Overbought (Possible price drop)
📌 Why Use RSI?
✅ Simple & Effective – Quickly identify buy/sell opportunities.
✅ Works with Any Market – Use it for crypto, stocks, forex, and more.
✅ Pairs Well with Other Indicators – Combine RSI with MACD or support & resistance for stronger signals.
🚀 Start Trading with RSI Today!
The RSI indicator is a great tool to improve your trading decisions. Apply it to your charts now and see how it helps you catch trends early!
💡 Tip: Always confirm RSI signals with other indicators or price action for the best results.